Table of Contents
ToggleWhat is a Data Warehouse in Data Warehousing?
A data warehouse is a centralized repository designed to store, manage, and analyze large volumes of structured and unstructured data from multiple sources. It is a core component of business intelligence (BI) and analytics, providing a foundation for reporting, analysis, and data mining. Here are some key features and aspects of a data warehouse:
Key Features:
- Subject-Oriented: Organized around major subjects of the enterprise such as customers, sales, products, or finance, rather than application-specific data.
- Integrated: Consolidates data from various sources, ensuring consistency in terms of naming conventions, formats, and data types.
- Non-Volatile: Once data is entered into the warehouse, it is not changed or deleted. This allows for historical analysis and comparison over time.
- Time-Variant: Data is stored with a time dimension, allowing for analysis of trends and changes over time.
Architecture Components:
Source Data: Data originates from various sources, including transactional databases, flat files, and external sources.
ETL Process (Extract, Transform, Load):
- Extract: Data is extracted from source systems.
- Transform: Data is cleaned, transformed, and prepared for storage.
- Load: Data is loaded into the data warehouse.
Data Storage:
- Staging Area: Temporary storage for data before transformation.
- Data Warehouse: Central repository for integrated and processed data.
- Data Marts: Subsets of the data warehouse tailored for specific business lines or departments.
Access Tools:
- Query and Reporting Tools: Enable users to generate reports and queries.
- OLAP (Online Analytical Processing) Tools: Allow for complex analytical queries and multidimensional analysis.
- Data Mining Tools: Help in discovering patterns and insights from large datasets.
Benefits:
Improved Decision-Making: Provides comprehensive and accurate data for informed decision-making.
Historical Intelligence: Enables analysis of historical data to identify trends and patterns.
Data Consistency and Quality: Ensures data is consistent, accurate, and reliable across the organization.
Performance: Optimized for read-heavy operations, enabling fast query performance for large datasets.
Use Cases:
Business Intelligence: Central repository for BI tools to generate reports, dashboards, and visualizations.
Analytics: Supports complex analytical queries and data mining.
Data Consolidation: Aggregates data from various sources for a unified view.
Examples of Data Warehouse Technologies:
Traditional RDBMS-based Warehouses: Examples include Oracle, SQL Server, and IBM Db2.
Cloud-based Data Warehouses: Examples include Amazon Redshift, Google BigQuery, and Snowflake.
------------------------------------------------------
What is a DataMart?
A data mart is a subset of a data warehouse, designed to serve the specific needs of a particular business line or department. While a data warehouse provides a centralized repository for the entire organization’s data, a data mart focuses on a particular segment, allowing for more specialized analysis and reporting.
Types of Data marts:
Dependent Data Marts:
- Created from an existing data warehouse.
- Serve specific departmental needs by drawing data from the centralized warehouse.
- Ensure consistency and integration with the overall enterprise data strategy.
Independent Data Marts:
- Created directly from operational or external data sources without relying on a central data warehouse.
- Useful for departments that need immediate, focused analysis but may result in data silos and inconsistency across the organization.
Hybrid Data Marts:
- Combine elements of both dependent and independent data marts.
- Can source data from both a central data warehouse and direct external sources.
What is a dimension ?
In data warehousing, a dimension is a structure that categorizes facts and measures to enable users to answer business questions. Dimensions provide context to the numerical data stored in fact tables. They are essential for defining the various perspectives from which data can be analyzed, such as time, geography, products, and customers.
Examples of Some Common Dimensions:
Time Dimension: Contains attributes related to time, such as date, week, month, quarter, and year. It allows for temporal analysis like trends over time.
Geography Dimension: Includes geographic attributes like country, region, state, and city. It helps in geographical analysis.
Product Dimension: Comprises attributes related to products, such as product ID, name, category, and brand.
Customer Dimension: Contains customer-related attributes such as customer ID, name, address, and segment.
What are Facts in Data Warehousing?
In data warehousing, facts are the central elements that represent quantitative data about events or transactions. They are typically numerical values that can be aggregated and analyzed, such as sales amounts, quantities, or performance metrics. Facts are stored in fact tables, which are the core components of a data warehouse schema.
Types of Facts:
Additive Facts: These can be summed across all dimensions. For example, sales revenue can be aggregated across time, geography, and product dimensions.
- Example: Total sales amount.
Semi-Additive Facts: These can be summed across some dimensions but not others. For example, account balances can be summed over time but not over different accounts.
- Example: Inventory levels.
Non-Additive Facts: These cannot be summed across any dimensions. For example, percentages and ratios are typically non-additive.
- Example: Profit margin percentage.
| Sale_ID | Product_ID | Customer_ID | Time_ID | Sales_Amount | Units_Sold |
|---|---|---|---|---|---|
| 1 | 101 | 1001 | 20220101 | 150.00 | 10 |
| 2 | 102 | 1002 | 20220102 | 200.00 | 20 |
| 3 | 101 | 1003 | 20220103 | 300.00 | 15 |
Types of Schemas :
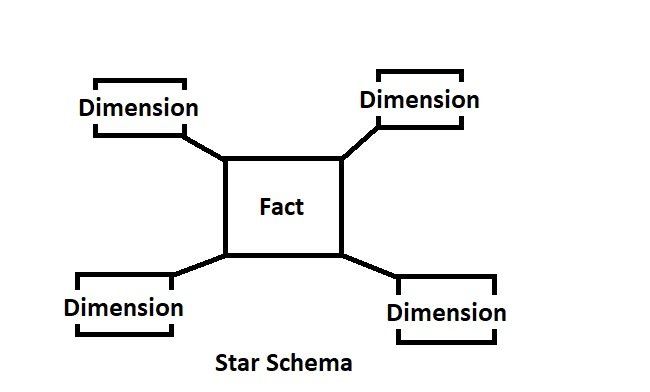
Star Schema:
The fact table is at the center, connected to multiple dimension tables.
Example:
- Fact Table: Sales_Fact (sales_id, product_id, customer_id, time_id, sales_amount, units_sold)
- Dimension Tables: Product_Dim (product_id, product_name, category), Customer_Dim (customer_id, customer_name, region), Time_Dim (time_id, date, month, year)
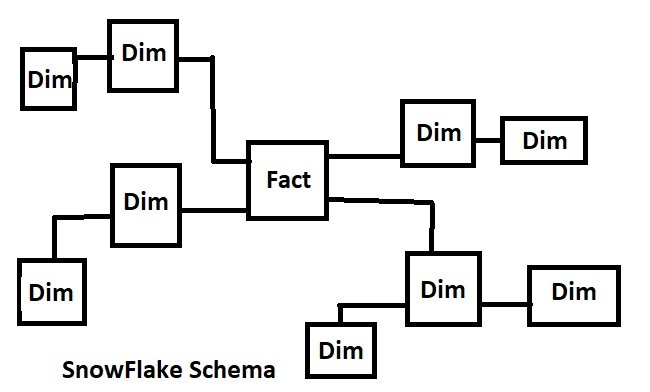
Snowflake Schema:
An extension of the star schema where dimension tables are normalized into multiple related tables.
- Fact Table: Sales_Fact (sales_id, product_id, customer_id, time_id, sales_amount, units_sold)
- Dimension Tables:
- Product_Dim (product_id, product_name, category_id)
- Category_Dim (category_id, category_name)
- Customer_Dim (customer_id, customer_name, region_id)
- Region_Dim (region_id, region_name)
- Time_Dim (time_id, date, month_id)
- Month_Dim (month_id, month_name, year)
FAQ's
Fact tables store quantitative data for analysis and often include foreign keys to dimension tables. Dimension tables store descriptive attributes related to facts and provide context to the data.
A type of database schema that consists of a central fact table surrounded by dimension tables. It is simple and easy to query.
An extension of the star schema where dimension tables are normalized into multiple related tables. It reduces data redundancy but can be more complex to query.
ETL stands for Extract, Transform, Load. It is a process used to extract data from various sources, transform it into a suitable format, and load it into the data warehouse.
Process of organizing data to minimize redundancy. Typically used in OLTP systems.
Process of combining tables to improve read performance, often used in data warehouses for faster query performance.
A data mart is a subset of a data warehouse tailored to the needs of a specific business line or department. It is designed to provide data access and analysis for a particular group of users.
SCD is a technique used to manage and track changes in dimension data over time. Common types are:
- SCD Type 1: Overwrites old data with new data.
- SCD Type 2: Creates a new record with a version or timestamp for each change.
- SCD Type 3: Stores previous and current data in separate columns.
A surrogate key is a unique identifier for each record in a table, often used in dimension tables. It is typically a sequential number and is not derived from application data.
Data quality issues can be addressed through data profiling, data cleansing, validation rules, and implementing ETL processes that include error handling and data correction steps.
A data lake is a storage repository that holds a vast amount of raw data in its native format until it is needed. Unlike a data warehouse, which stores structured data optimized for querying and analysis, a data lake can store both structured and unstructured data.
Aggregate tables store pre-computed summarized data to speed up query performance. They reduce the need to compute complex aggregations on the fly, thereby improving response times for queries.
Techniques include indexing, partitioning, using materialized views, query optimization, denormalization, and optimizing ETL processes to ensure efficient data loading.
A materialized view is a database object that contains the results of a query. Unlike regular views, materialized views store data physically and are refreshed periodically to reflect changes in the underlying tables.
Partitioning involves dividing a database into smaller, more manageable pieces called partitions. It can improve performance and manageability, especially for large datasets, by allowing queries to scan only relevant partitions.
Common ETL tools include Informatica PowerCenter, Microsoft SQL Server Integration Services (SSIS), Talend, Apache Nifi, and Oracle Data Integrator (ODI).
Popular solutions include Amazon Redshift, Google BigQuery, Snowflake, Microsoft Azure Synapse Analytics, Oracle Exadata, and IBM Db2.
Identify key business processes and metrics (e.g., sales, inventory). Design fact tables for transactions and dimension tables for products, customers, time, and locations. Consider ETL processes to load data from operational systems into the data warehouse.
Common challenges include data integration from disparate sources, ensuring data quality, managing large volumes of data, and optimizing query performance. Solutions may involve using robust ETL tools, implementing data quality frameworks, using partitioning and indexing, and choosing scalable storage solutions.
Implement data encryption, access controls, audit trails, and regular security assessments. Use roles and permissions to control access to sensitive data and ensure compliance with data protection regulations.
For More details Please Click Here