

Table of Contents
TogglePower BI Full Course for Beginners
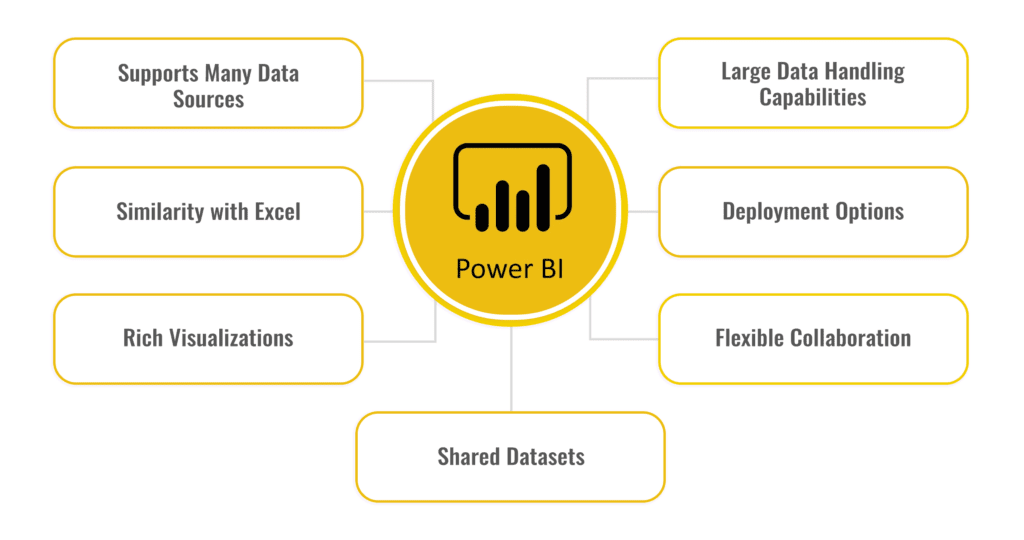
Power BI is a powerful business analytics tool developed by Microsoft that allows users to visualize data, share insights, and make data-driven decisions. This course is designed to guide beginners through the process of understanding Power BI, from basic concepts to creating interactive reports and dashboards.
Module 1: Introduction to Power BI
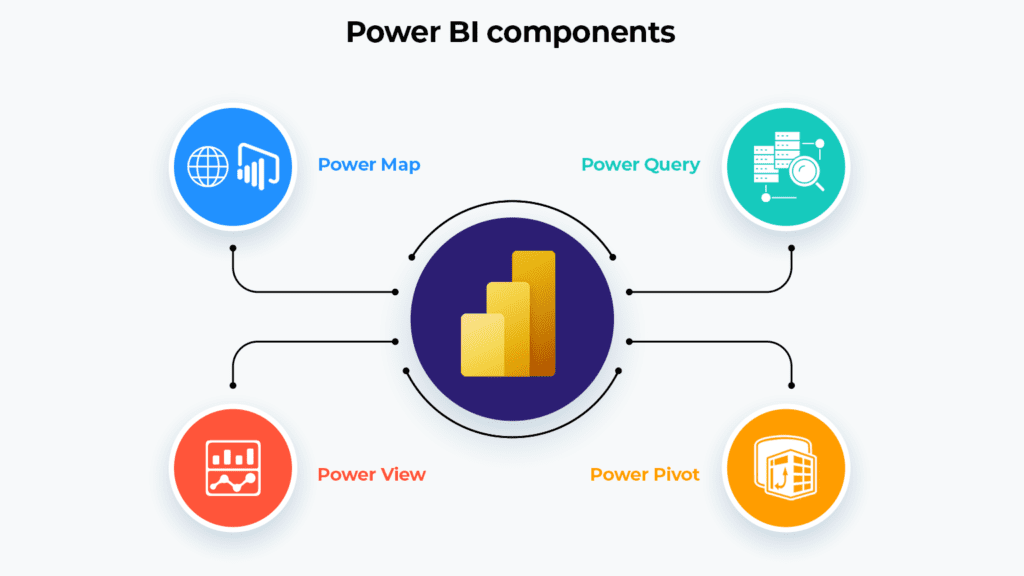
Power BI is part of Microsoft’s suite of data visualization tools. It consists of three main components:
- Power BI Desktop: A free application used to create reports and data models.
- Power BI Service: The online platform for sharing and collaborating on reports.
- Power BI Mobile: A mobile app to view reports and dashboards on the go.
The course begins with an introduction to the Power BI interface and installation. You’ll learn how to download Power BI Desktop and set up your first project. Understanding Power BI’s role in data analytics and business intelligence is key to leveraging its full potential.
Module 2: Getting Started with Power BI
Power BI enables users to pull data from various sources like Excel, SQL databases, web services, and more. In this section, you’ll explore how to connect to data sources and import data into Power BI. Power Query is used to clean and transform data before loading it into the Power BI model.
- Connecting to Data: Learn how to connect to different data sources like Excel, text files, databases, and online services.
- Power Query Editor: Introduction to Power Query for transforming data (filtering rows, changing data types, etc.).
Module 3: Data Transformation with Power Query
Data typically needs to be transformed before it can be analyzed effectively. Power Query Editor offers a variety of functions for cleaning and shaping data. You’ll learn how to:
- Clean and Transform Data: Remove duplicates, filter unnecessary rows, and adjust data formats.
- Merge and Append Queries: Combine multiple data sources into one model using merge and append operations.
- Split Columns and Remove Errors: Handling common data issues like missing values, incorrect types, and duplicate entries.
Module 4: Data Modeling
Once your data is cleaned, it’s time to model it for analysis. Power BI allows you to create relationships between different data tables, ensuring that your analysis reflects how the data is connected.
- Creating Relationships: Define relationships between tables, such as one-to-many and many-to-one relationships, which are essential for accurate reporting.
- Data Modeling Best Practices: Learn the importance of using a star schema or snowflake schema for efficient data modeling.
- Introduction to DAX: DAX (Data Analysis Expressions) is used for creating calculated columns and measures. You’ll start with basic functions like SUM, AVERAGE, and COUNT.
Module 5: Visualizing Data
One of the core features of Power BI is its ability to create interactive visualizations. In this module, you’ll learn how to represent your data using different charts and graphs.
- Basic Visualizations: Learn how to create basic visualizations such as bar charts, line charts, pie charts, and tables.
- Advanced Visuals: Explore other advanced visualizations like maps, gauges, and KPIs (Key Performance Indicators).
- Formatting Visuals: Customize the appearance of visuals by adjusting colors, labels, legends, and axis formatting.
- Interactive Elements: Add slicers and filters to allow users to interact with the visuals, enabling them to drill down into data.
Module 6: Using DAX for Advanced Analysis
DAX is a powerful formula language in Power BI used to perform complex calculations on data. You’ll learn how to write measures and calculated columns to derive insights.
- Calculated Columns vs Measures: Understand the difference and use cases for calculated columns and measures.
- Time Intelligence: Work with DAX functions that calculate values over time, such as Year-To-Date (YTD), Month-To-Date (MTD), and Quarter-To-Date (QTD).
- Advanced DAX Functions: Learn key functions like CALCULATE, FILTER, and ALL, which allow for more sophisticated data analysis.
Module 7: Power BI Service and Sharing Reports
After building your report in Power BI Desktop, you’ll want to share your insights. Power BI Service is the cloud platform where you can publish and share reports and dashboards with others.
- Publishing to Power BI Service: Learn how to publish your Power BI reports from Power BI Desktop to the Power BI Service.
- Creating Dashboards: In Power BI Service, you can create dashboards by pinning visuals from multiple reports into a single view.
- Sharing Reports: Explore how to share reports and collaborate with team members within the Power BI ecosystem.
- Data Refresh: Set up scheduled data refresh to ensure that reports always display the most up-to-date information.
Module 8: Advanced Features and Security
As you become more comfortable with Power BI, you’ll explore advanced features that can enhance your reports and dashboards.
- Row-Level Security (RLS): Learn how to implement security features that restrict data access based on the user’s role.
- Power BI Gateways: Understand how to set up and use Power BI Gateway to refresh on-premises data sources.
- Embedding Power BI: Learn how to embed your Power BI reports into other applications, enabling wider distribution of your insights.
Module 9: Best Practices and Optimization
Effective Power BI development requires following best practices for creating readable and efficient reports.
- Design Principles: Learn to choose the right visuals, design layouts that are easy to read, and avoid clutter.
- Performance Optimization: Improve report performance by reducing unnecessary calculations and optimizing queries.
Module 10: Final Project
The course culminates in a final project where you’ll create a full-fledged Power BI report or dashboard from scratch. Choose a dataset (e.g., sales, finance, or marketing), clean and transform the data, build the necessary relationships, and visualize it with Power BI’s rich features. You’ll publish the report and share it on the Power BI Service.
Conclusion
By the end of this course, you will have a solid understanding of Power BI’s features, from data importing and transformation to building interactive visualizations and sharing reports. You’ll be able to confidently create insightful dashboards and reports to help businesses make data-driven decisions.
Additional Resources
- Microsoft Learn: A great free resource for Power BI tutorials and documentation.
- YouTube Channels: Follow channels like Guy in a Cube and Curbal for expert tips.
- Books: “The Definitive Guide to DAX” by Marco Russo and Alberto Ferrari is a great read for diving deeper into Power BI’s DAX capabilities.
This course will help you become proficient in Power BI, empowering you to unlock the full potential of your data and communicate insights effectively.